
Visulalize Boost Voronoi in OpenSceneGraph
Abstract. One of the important features of the boost polygon library is the implementation of the generic sweepline algorithm to construct Voronoi diagrams of points and linear segments in 2D(developed as part of the Google Summer of Code 2010 program). Voronoi diagram data structure has applications in image segmentation, optical character recognition, nearest neighbor queries execution. It is closely related with the other computational geometry conectps: Delaunay triangulation, medial axis, straight skeleton, the largest empty circle. The paper focus on the usage of Boost.Polygon Voronoi Diagram and visualize it in OpenSceneGraph.
Key words. Voronoi, Boost.Polygon, C++, OpenSceneGraph, Visualization
1. Introduction
计算几何(Computational Geometry)作为一门学科,起源于20世纪70年代,经过近四十多年的发展,其研究内容不断扩大,涉及Voronoi图、三角剖分、凸包、直线与多边形求交、可见性、路径规划、多边形剖分等内容。据相关统计,在数以千计的相关文章中,约有15%是关于Voronoi图及其对偶(dual)图Delaunay三角剖分(Delaunay Triangulation)的研究。由于Voronoi图具有最近性、邻接性等众多性质和比较系统的理论体系,如今已经在计算机图形学、机械工程、地理信息系统、机器人、图像处理、大数据分析与处理、生物计算及无线传感网络等领域得到了广泛应用,同时也是解决碰撞检测、路径规划、可见性计算、骨架计算以及凸包计算等计算几何所涉及的其他问题的有效工具。
Voronoi图的起源最早可以追溯到17世纪。1644年,Descartes用类似Voronoi图的结构显示太阳系中物质的分布。数学家G.L. Dirichlet和M.G.Voronoi分别于1850年和1908年在他们的论文中讨论了Voronoi图的概念,所以Voronoi图又叫Dirichlet tessellation。在其他领域,这个概念也曾独立地出现,如生物学和生理学中称之为中轴变换(Medial Axis Transform)或骨架(Skeleton)。化学与物理学中称之为Wigner-Seitz Zones,气象学与地理学中称之为Thiessen多边形。Voronoi图最早由Thiessen应用于气象观测站中随机分布的研究。由于M.G. Voronoi从更通用的n维情况对其进行研究和定义,所以Voronoi图这个名称为大多数人所使用。
在路径规划、机械加工、模式识别、虚拟现实、生物计算等领域,将站点从离散点扩展到线段圆弧等生成Voronoi图的方式也是非常常见的。
目前可用于生成Voronoi图的库有一些,很多是开源库。像CGAL库、boost中也提供了生成Voronoi图的算法。本文根据Boost.Polygon中的Voronoi库,并用OpenSceneGraph显示出剖分结果。
2. Boost.Polygon Voronoi Diagram
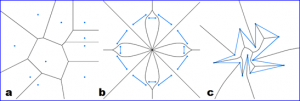
Boost.Polygon库提供了构造Voronoi图的接口,可根据点集、线段集来生成Voronoi图,如下图所示:

Figure 2.1 Voronoi Diagram generated by Boost.Polygon Voronoi Algorithms
Boost.Polygon中的基于扫描线算法(sweep-line algorithm)Voronoi库可以实现如下功能:
v 输入数据可以是点集和线段;
v 算法的稳定性高及输出完整的拓朴信息;
v 可以控制输出的几何信息的精度;
计算几何方面以稳定性著称的CGAL库中的Voronoi算法只满足前两个功能。S-Hull库以上功能都没有很好的满足。下面是一些Boost.Polygon,CGAL,S-Hull库的对比数据:


Figure 2.2 Construction time for 10 random points

Figure 2.3 Construction time for 100 random points

Figure 2.4 Construction time for 1000 random points

Figure 2.5 Construction time for 10000 random points

Figure 2.6 Memory usage for 100000 random points

Figure 2.7 Logarithmic Execution Time
结论:
v 在输入上没有限制这点上CGAL要优于Boost.Polygon;
v Boost.Polygon Voronoi的稳定性要高于S-Hull;
v Boost.Polygon Voronoi和S-Hull的时间复杂度为N*log(N),而CGAL的不是;
v Boost.Polygon Voronoi的输出顶点的精度高于CGAL库;
v Boost.Polygon Voronoi的速度快;
v Boost.Polygon Voronoi根据10000个点或1000个线段来构造Voronoi的时间为0.02秒以内,所以可用来处理有实时性要求的场景;
3. Implementation
Boost.Polygon的Voronoi算法使用简单,只需要输入点集或线段集合,就可以直接构造出Voronoi图了。最简单的程序示例代码如下:
/*
*    Copyright (c) 2014 eryar All Rights Reserved.
*
*        File    : Main.cpp
*        Author  : eryar@163.com
*        Date    : 2014-05-06 18:28
*        Version : V1.0
*
*    Description : The Simplest example for boost voronoi library.
*      Key words : boost voronoi, C++
*
*/

#include \"boost/polygon/voronoi.hpp\"

using namespace boost::polygon;

typedef int coordinate_type;
typedef point_data<coordinate_type> Point;
typedef voronoi_diagram<double> VD;

int main(int argc, char* argv[])
{
    std::vector<Point> points;

    points.push_back(Point(0, 0));
    points.push_back(Point(1, 6));
    points.push_back(Point(-4, 5));
    points.push_back(Point(5, -1));
    points.push_back(Point(3, -11));
    points.push_back(Point(13, -1));

    VD vd;
    construct_voronoi(points.begin(), points.end(), &vd);

    return 0;
}
且Boost.Polygon的Voronoi算法遍历Voronoi边Edges,Voronoi单元cell,Voronoi顶点Vertex也很直接。如下代码所示为遍历所有边,来将剖分结果可视化:
/*
*    Copyright (c) 2014 eryar All Rights Reserved.
*
*        File    : Main.cpp
*        Author  : eryar@163.com
*        Date    : 2014-05-06 18:28
*        Version : V1.0
*
*    Description : VoronoiViewer for boost voronoi library visulization.
*      Key words : boost voronoi, C++, OpenSceneGraph
*
*/

#include <osgViewer/Viewer>
#include <osgGA/StateSetManipulator>
#include <osgViewer/ViewerEventHandlers>

#pragma comment(lib, \"osgd.lib\")
#pragma comment(lib, \"osgDBd.lib\")
#pragma comment(lib, \"osgGAd.lib\")
#pragma comment(lib, \"osgViewerd.lib\")


#include \"boost/polygon/voronoi.hpp\"

using namespace boost::polygon;

typedef double coordinate_type;
typedef point_data<coordinate_type> Point;
typedef voronoi_diagram<coordinate_type> VD;


osg::Node* BuildVoronoiDiagram(void)
{
    srand(static_cast<unsigned int> (time(NULL)));

    osg::ref_ptr<osg::Geode> theGeode = new osg::Geode();
    osg::ref_ptr<osg::Geometry> theLines = new osg::Geometry();
    osg::ref_ptr<osg::Vec3Array> theVertices = new osg::Vec3Array();

    VD vd;
    std::vector<Point> thePoints;

    // Add points for the Voronoi Diagram.
    for (int i = 0; i < 100; ++i)
    {
        int x = rand() % 100;
        int y = rand() % 100;

        thePoints.push_back(Point(x, y));

        // Display the site of the Voronoi Diagram.
        theVertices->push_back(osg::Vec3(x - 1, 0.0, y));
        theVertices->push_back(osg::Vec3(x + 1, 0.0, y));

        theVertices->push_back(osg::Vec3(x, 0.0, y - 1));
        theVertices->push_back(osg::Vec3(x, 0.0, y + 1));
    }

    construct_voronoi(thePoints.begin(), thePoints.end(), &vd);

    // Visualize the edge of the Voronoi Diagram.
    // Traversing Voronoi edges using edge iterator.
    for (VD::const_edge_iterator it = vd.edges().begin(); it != vd.edges().end(); ++it)
    {
        if (it->is_primary())
        {
            if (it->is_finite())
            {
                theVertices->push_back(osg::Vec3(it->vertex0()->x(), 0.0, it->vertex0()->y()));
                theVertices->push_back(osg::Vec3(it->vertex1()->x(), 0.0, it->vertex1()->y()));
            }
            else
            {
                Point p1 = thePoints[it->cell()->source_index()];
                Point p2 = thePoints[it->twin()->cell()->source_index()];
                Point origin;
                Point direction;
                coordinate_type koef = 1.0;

                origin.x((p1.x() + p2.x()) * 0.5);
                origin.y((p1.y() + p2.y()) * 0.5);

                direction.x(p1.y() - p2.y());
                direction.y(p2.x() - p1.x());

                if (it->vertex0() == NULL)
                {
                    theVertices->push_back(osg::Vec3(
                        origin.x() - direction.x() * koef,
                        0.0,
                        origin.y() - direction.y() * koef));
                }
                else
                {
                    theVertices->push_back(osg::Vec3(it->vertex0()->x(), 0.0, it->vertex0()->y()));
                }

                if (it->vertex1() == NULL)
                {
                    theVertices->push_back(osg::Vec3(
                        origin.x() + direction.x() * koef,
                        0.0,
                        origin.y() + direction.y() * koef));
                }
                else
                {
                    theVertices->push_back(osg::Vec3(it->vertex1()->x(), 0.0, it->vertex1()->y()));
                }
            }
        }
    }

    theLines->setVertexArray(theVertices);

    // Set the colors.
    osg::ref_ptr<osg::Vec4Array> theColors = new osg::Vec4Array();
    theColors->push_back(osg::Vec4(1.0f, 1.0f, 0.0f, 1.0f));

    theLines->setColorArray(theColors);
    theLines->setColorBinding(osg::Geometry::BIND_OVERALL);

    // Set the normal.
    osg::ref_ptr<osg::Vec3Array> theNormals = new osg::Vec3Array();
    theNormals->push_back(osg::Vec3(0.0f, -1.0f, 0.0f));

    theLines->setNormalArray(theNormals);
    theLines->setNormalBinding(osg::Geometry::BIND_OVERALL);

    theLines->addPrimitiveSet(new osg::DrawArrays(osg::PrimitiveSet::LINES, 0, theVertices->size()));

    theGeode->addDrawable(theLines);

    return theGeode.release();
}


int main(int argc, char *argv[])
{
    osgViewer::Viewer theViewer;

    theViewer.setSceneData(BuildVoronoiDiagram());
    theViewer.addEventHandler(new osgGA::StateSetManipulator(theViewer.getCamera()->getOrCreateStateSet()));
    theViewer.addEventHandler(new osgViewer::StatsHandler);
    theViewer.addEventHandler(new osgViewer::WindowSizeHandler);

    return theViewer.run();
}
绘制Voronoi的边时,当边是有限的finite时,直接可以画出直线;当边是infinite时,根据定义计算出了无界边的方向。显示结果如下图所示:

Figure 3.1 Construct Voronoi Diagram by 10 random points by Boost.Polygon

Figure 3.2 Construct Voronoi Diagram by 100 random points by Boost.Polygon
4. Conclusion
Boost.Polygon中的Voronoi图算法稳定性及性能较高,且可以根据站点查找相关的拓朴信息,如根据站点查找Voronoi单元等;惟一不足的就是默认只处理整数点集。
当输入有线段时,生成的Voronoi图中有曲线,曲线的绘制可参考相关例子实现。
Boost.Polygon中的Voronoi算法都以模板实现,编译时只需要包含相关的头文件即可,不依赖其他库,使用还是很方便的。
5. References
2. Boost.Polygon,http://www.boost.org/doc/libs/1_55_0/libs/polygon/doc/index.htm
3. Voronoi Basic Tutorial,\\boost_1_54_0\\libs\\polygon\\doc\\voronoi_basic_tutorial.htm
4. 汪嘉业, 王文平, 屠长河, 杨承磊. 计算几何及应用. 科学出版社. 2011
5. 杨承磊, 吕琳, 杨义军, 孟祥旭. Voronoi图及其应用. 清华大学出版社. 2013
PDF Version and Source Code: Visulalization Boost Voronoi in OpenSceneGraph

![[转]我国CAD软件产业亟待研究现状采取对策-卡核](https://www.caxkernel.com/wp-content/uploads/2024/07/frc-f080b20a9340c1a89c731029cb163f6a-212x300.png)